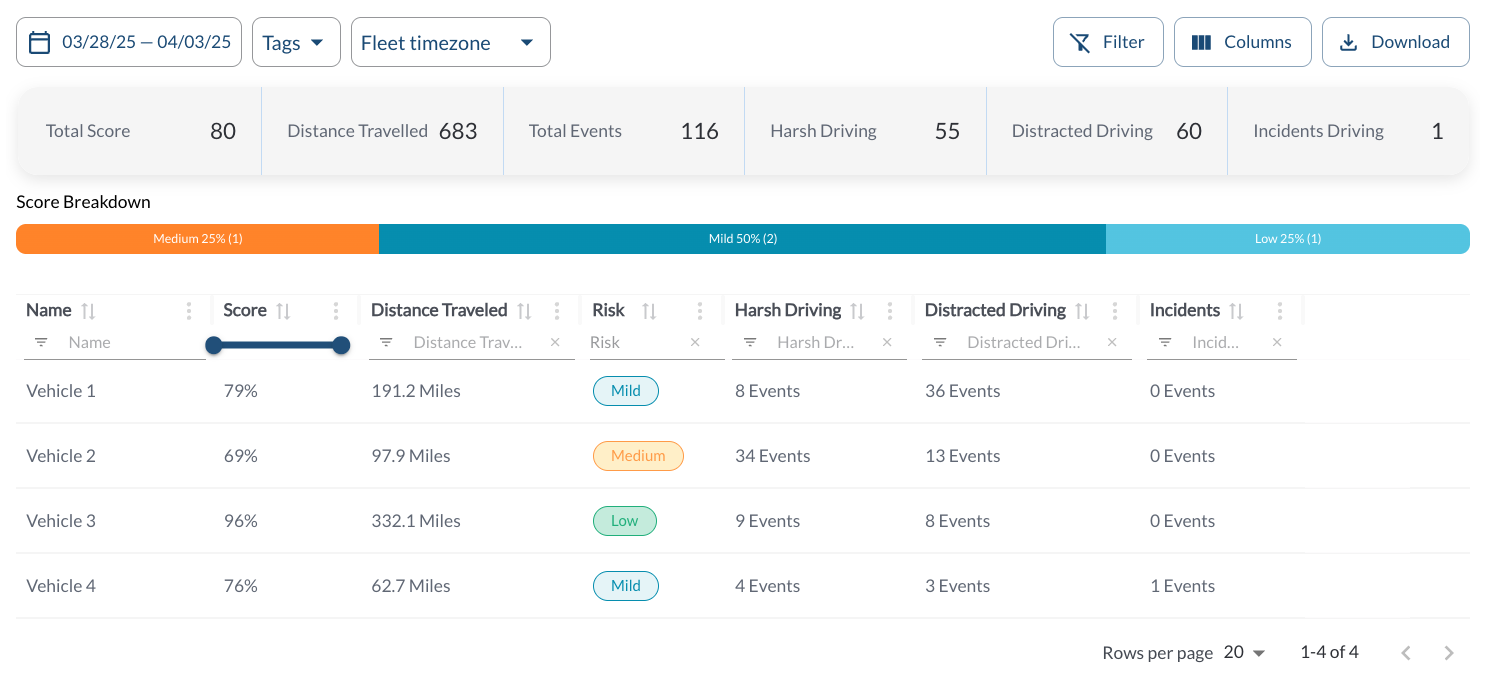
The Vehicle Performance page shows vehicle safety and performance data within a selected date range. This page helps fleet managers analyze key metrics, track individual vehicle behavior, and identify areas for improvement.
Fleet Key Metrics
Key fleet metrics for the selected date range are displayed in summary boxes, including:
-
Total Score: The overall fleet safety score.
-
Distance Traveled: The cumulative distance covered by all vehicles.
-
Total Events: The total number of safety events recorded.
-
Total Harsh Driving Events: The total number of harsh driving events across the fleet.
-
Total Distracted Driving Events: The total number of distracted driving events across the fleet.
-
Total Incident Events: The total number of incidents events across the fleet.
Score Breakdown
Score Breakdown Bar visually represents the distribution of vehicles across different risk categories:
- High Risk
- Medium Risk
- Low Risk
This breakdown highlights the proportion of vehicles in each category. For details, read the article Understanding Safety Score.
Vehicle Safety Details
The table displays all the vehicle's safety events, allowing you to efficiently organize and access the details. It supports downloading, sorting, filtering, resizing columns, and other customization options. For a complete guide, read the article How to Use Tables in the App.
The table includes the following columns, each providing specific vehicle safety information:
| Vehicle Name |
The name of the vehicle |
| Vehicle Score |
The safety score representing the vehicle’s performance. For details, read the article Understanding Safety Score. |
| Distance Traveled |
The total distance covered by the vehicle |
| Risk |
The vehicle’s overall risk category (e.g., high, medium, low) |
| Number of Harsh Driving Events |
The total number of harsh driving events recorded |
| Number of Distracted Driving Events |
The total number of distracted driving events recorded |
| Number of Incident Events |
The total number of incident events recorded |
Filtering
-
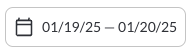
Use the Date Picker to select a different date range. The default date range is Today. For more details on using the Date Picker, read the article How to Use the Date Picker.
-
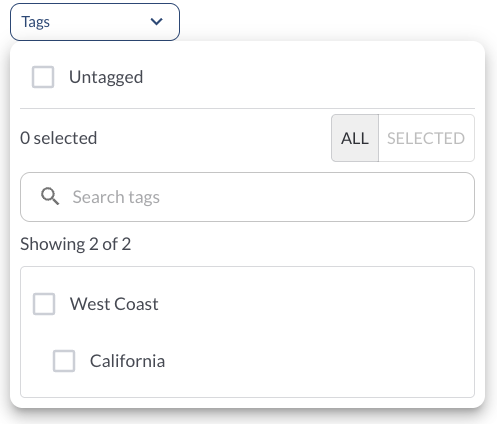
Use the Tag Filter to narrow down the table to display only trips associated with specific tags.
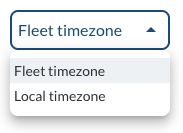
- Use the Timezone Filter to select how timestamps are displayed and how data is fetched based on the selected timezone.
Custom Report Widget
Save time by using the Custom Report Widget to store report configurations with your selected filters, columns, sorting, and grouping. This allows you to quickly return to commonly used report setups and set a default configuration for easy access. For more information, read the article How to Use the Custom Report Widget.