The Health History page in Device Health provides a full log of all health status changes for each device. Each entry includes the status the device changed to and the reason it was triggered, giving fleet managers complete visibility into the health timeline of their devices.
History Details
The table displays all device history records. It supports downloading, sorting, filtering, resizing columns, and other customization options. For a complete guide, read the article How to Use Table Options.
The table includes the following columns, each providing specific record details:
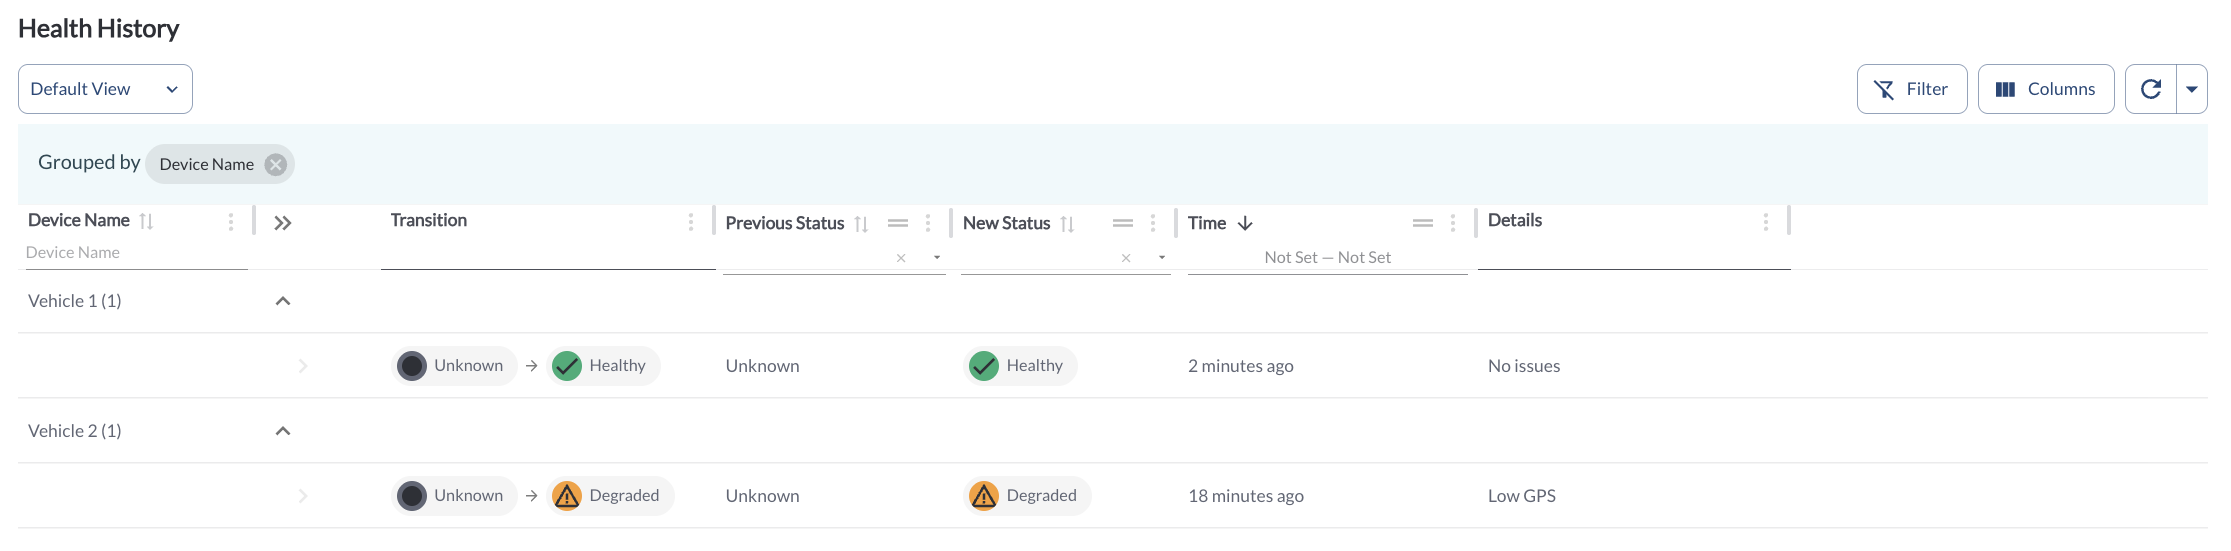
| Transition |
A visual representation of the status change, showing the previous status and the new status (e.g., Unknown → Healthy) |
| Previous Status |
The health status the device held before the change |
| New Status |
The health status the device changed to |
| Time |
When the status change occurred |
| Details |
The reason the status change was triggered |
Refresher Widget
Keep your data up to date by using the Refresher Widget. This allows you to reload the table data and ensure you’re viewing the latest information. For more information, read the article How to Use the Refresher Widget.
Grouping the Table
By default, the Time on Site Report table is grouped by Address, allowing you to see aggregated time on site and idling time for each location. For more information, read the article How to Use the Tables in the App.
Custom Report Widget
Save time by using the Custom Report Widget to store report configurations with your selected filters, columns, sorting, and grouping. This allows you to quickly return to commonly used report setups and set a default configuration for easy access. For more information, read the article How to Use the Custom Report Widget.