The Speeding Report provides a fleet-wide view of all speeding events recorded across your vehicles. This helps fleet managers identify high-risk driving behavior, monitor compliance with speed limits, and take corrective action, reducing the risk of accidents and improving overall fleet safety.
Speeding Report Details
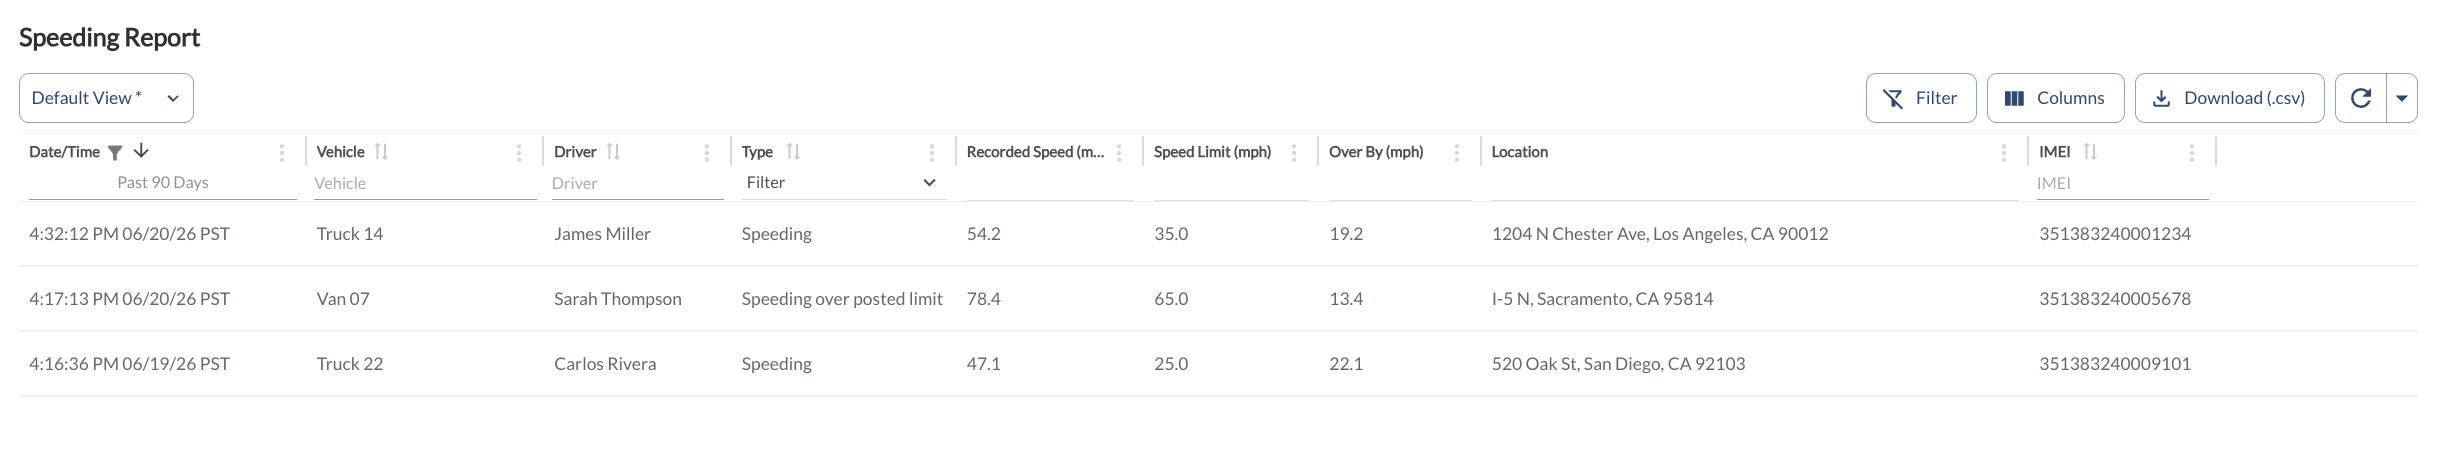
The report displays all speeding events across your fleet. It supports downloading, sorting, filtering, resizing columns, and other customization options. For a complete guide, read the article How to Use Table Options.
The table includes the following columns, each providing specific speeding event details:
| Date/Time |
The date and time the speeding event was recorded. |
| Vehicle |
The name of the vehicle associated with the speeding event |
| Driver |
The name of the driver assigned to the vehicle at the time of the event |
| Type |
The type of speeding event (e.g., Speeding, Speeding over posted limit) |
| Recorded Speed |
The actual speed of the vehicle at the time of the event |
| Speed Limit |
The posted or configured speed limit applicable at the time of the event |
| Over By |
The amount by which the vehicle exceeded the speed limit |
| Location |
The address where the speeding event occurred, based on GPS data |
| IMEI |
The unique identifier of the device installed in the vehicle |
| Tags |
Tags assigned to the vehicle, used to categorize and filter results |
Refresher Widget
Keep your data up to date by using the Refresher Widget. This allows you to reload the table data and ensure you’re viewing the latest information. For more information, read the article How to Use the Refresher Widget.
Custom Report Widget
Save time by using the Custom Report Widget to store report configurations with your selected filters, columns, sorting, and grouping. This allows you to quickly return to commonly used report setups and set a default configuration for easy access. For more information, read the article How to Use the Custom Report Widget.