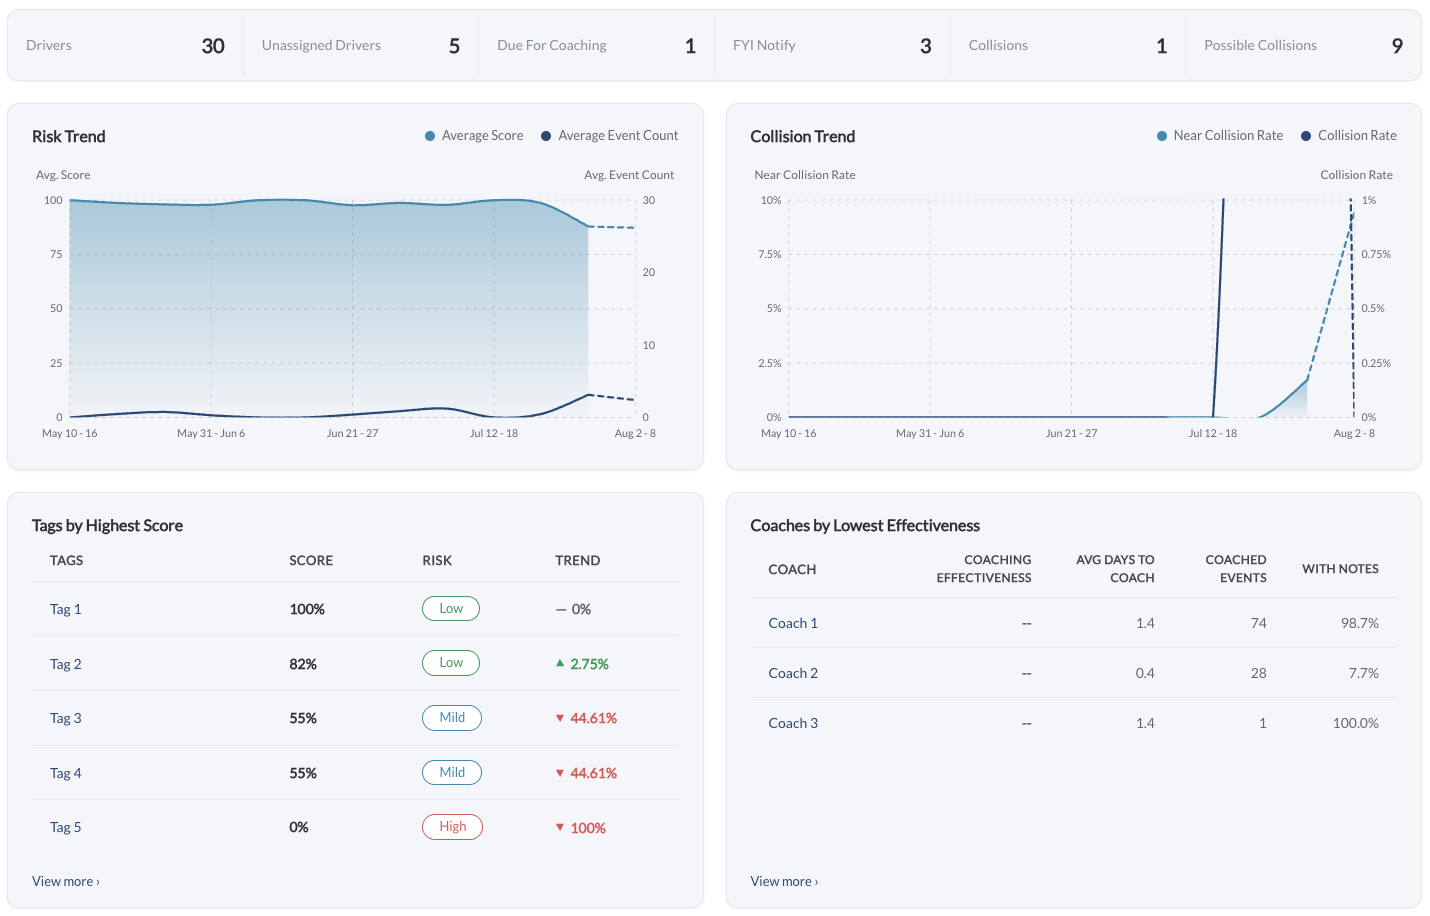
The Driver Safety Dashboard is the landing page of the Driver Safety menu. It summarizes the state of your coaching program in one screen: how much work is open, how scores and collision rates are trending, and which groups, coaches, and drivers need attention.
The dashboard is a browse-only page. Every action – assigning a driver, coaching a task, recognizing a driver – happens on the page you open from the dashboard.
Filtering
Two controls at the top of the page scope every widget on the dashboard:
-
Date Range – the period used for all counters, charts, and leaderboards. For more details on using the date picker, read the article How to Use the Date Picker.
-
Filter By Tag – narrows the dashboard to drivers and assets carrying the selected tags. Selecting a parent tag includes all of its child tags.
Note
Filter By Tag can only narrow what you already have access to. If your user is limited to specific tags, the filter selects from within that set.
Summary Bar
A single card across the top of the page shows six counters:
| Drivers |
Number of drivers visible under the active filters. |
| Unassigned Drivers |
Number of safety events that have no driver assigned. These events appear in the Assign Drivers queue. |
| Due For Coaching |
Number of open coaching tasks, with the overdue count shown underneath in red. |
| FYI Notify |
Number of open tasks with the FYI Notify coaching status. |
| Collisions |
Number of open tasks in the Collisions queue. |
| Possible Collisions |
Number of open tasks for events flagged as a possible collision. |
Trend Charts
Two charts show 13 weekly buckets across the selected period. The final segment of each line is dashed because the current week is still in progress.
| Risk Trend |
Average Safety Score per week on the left axis, and average event count per week on the right axis. |
| Collision Trend |
Near collision rate on the left axis and collision rate on the right axis, both shown as percentages. |
Leaderboards
Each panel below shows a short list with a View more link to the full report.
| Tags by Highest Score |
Top five tags by Safety Score, with a risk level and a trend indicator. Opens the Group Report. |
| Coaches by Lowest Effectiveness |
Five coaches with the lowest Coaching Effectiveness, plus average days to coach, coached events, and the percentage of sessions with notes. Opens the Coaches Report. |
| Drivers by Highest Score |
Top five drivers by Safety Score, with a risk level and a trend indicator. Opens the Driver Report. |
| Behaviors by Highest Frequency |
Five most frequent behaviors in the period, shown as a bar list. Opens the Behavior Report. |
| Drivers by Most Overdue Self-Coaching Events |
Eight drivers with the most overdue self-coaching events, with their group and self-coaching completion rate. Opens the Open Tasks Report. |
For the Score, Risk, and Trend columns, read the article Understanding the Driver Safety Score. For Coaching Effectiveness and the coaching activity columns, read the article Understanding Coaching Effectiveness.