The AI Usage tab in Settings shows what the AI features on your account have used and what it has cost. It appears only when an AI feature is enabled for your account.
Period
A selector at the top right sets the period covered by the summary cards, the daily chart, and the three breakdown tables. The default is the last 30 days.
The Monthly AI Budget bar is the exception – it always reflects the current calendar month, whatever period you select.
Monthly AI Budget
A progress bar showing estimated month-to-date spend against your monthly budget, with the two figures and the percentage used shown alongside it.

Warning
I requests are blocked once estimated spend reaches 120% of the monthly budget. Features such as Coach Assist stop returning content until the next calendar month, or until the budget is raised.
The 20% allowance above the budget exists because costs are estimated rather than billed in real time. Treat the budget as the point to review usage, not as the point at which features stop.
Summary Cards
| Estimated Cost | Estimated spend for the selected period. |
| Requests | How many AI requests were made. |
| Input Tokens | The volume of text sent to the AI provider. A driver with a long event history makes for a larger request than a driver with a short one. |
| Output Tokens | The volume of text generated in response. |
Input tokens are typically several times output tokens, because a request carries the driver's record and the response is a short summary.

Estimated Cost per Day
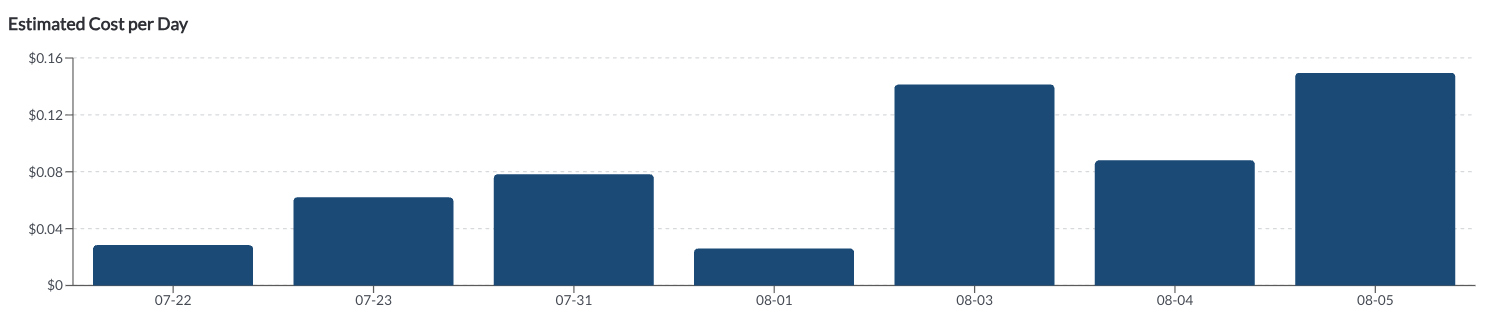
A bar chart of estimated spend per day across the selected period. Days with no AI activity are omitted rather than shown as an empty column, so the chart shows only the days something happened.
This is the quickest way to see whether usage is steady or driven by a few heavy days – a single tall bar usually means a batch of coaching sessions were worked through in one sitting.
Breakdown Tables
Three tables split the same period three ways. All use the columns Requests, Input, Output, and Est. Cost.
| By Provider | Which AI provider served the requests. More than one provider can appear, because different features use different providers. |
| By Feature | Which feature made the requests. This is the table to read when you want to know what is driving your spend. |
| By Model | Which model served the requests. Models differ in cost, so a feature using a larger model contributes more per request than one using a lighter model. |