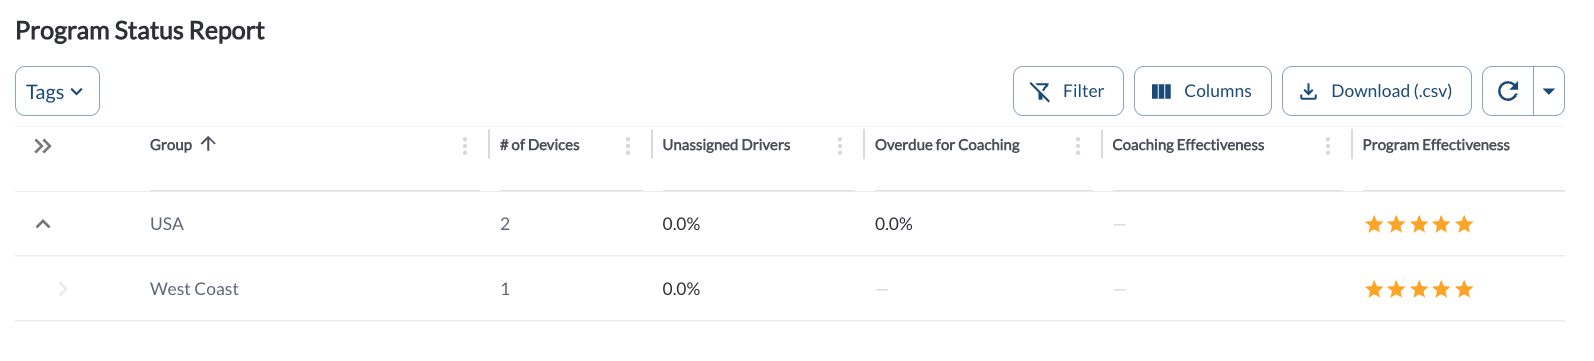
The Program Status Report is a program-health view per group. Instead of measuring driving behavior, it measures how well the coaching program itself is running: whether events are being attributed to drivers, whether coaching is being completed on time, and how effective that coaching is.
The report covers a fixed window of the last 30 days. Rows are hierarchical – each row rolls up the group itself plus all of its child groups.
Program Status Report Details
The table supports downloading, sorting, filtering, resizing columns, and other customization options. For a complete guide, read the article How to Use Tables in the App.
| Group |
The group name. Click the caret to expand the child groups. |
| # of Devices |
Distinct assets across the group and its child groups. |
| Unassigned Drivers |
Percentage of safety events in the last 30 days that have no driver assigned. Shown in bold red when above 20%. |
| Overdue for Coaching |
Percentage of currently open coaching tasks that are past their due date. Shown in bold red when above 25%. This includes the whole open backlog, not only tasks created in the last 30 days. |
| Coaching Effectiveness |
Average effectiveness across the coaches who ran at least one session for a driver in the group. |
| Program Effectiveness |
A combined 1–5 star rating derived from the three metrics above. |
A dash is displayed when a group has no data for that metric – for example no events in the window, or no open tasks.
Program Effectiveness
The star rating combines the three operational metrics so that groups can be compared at a glance. It rewards high Coaching Effectiveness, a low percentage of unassigned drivers, and a low percentage of overdue coaching. Coaching Effectiveness carries the largest share of the rating.
Ratings are rounded to the nearest half star. A group with no data for all three metrics shows a dash rather than a default rating.
Note
A coach who also coaches drivers outside the group contributes their overall effectiveness for the window to that group's average. Use the Coach Profile for a per-driver breakdown.
Filtering
-
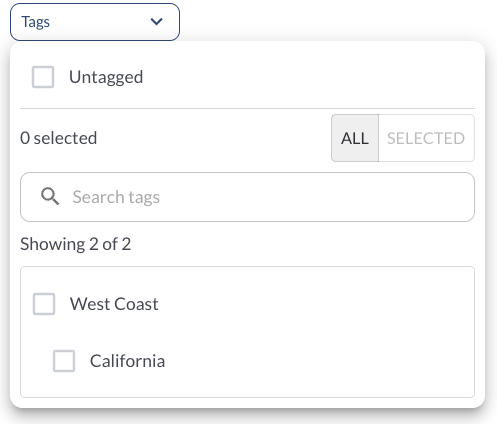
Use the Tag Filter to narrow down the table to display only trips associated with specific tags.
Refresher Widget
Keep your data up to date by using the Refresher Widget. This allows you to reload the table data so you're always viewing the latest information. To learn more, read the article How to Set the Refresher Widget.