The Driver Report compares driver safety performance across the fleet for a selected period. It has three tabs: Driver Scores, Continual Behaviors, and Alerts.
Every driver in the fleet appears in the report, including drivers with no events in the period.
Driver Scores Tab
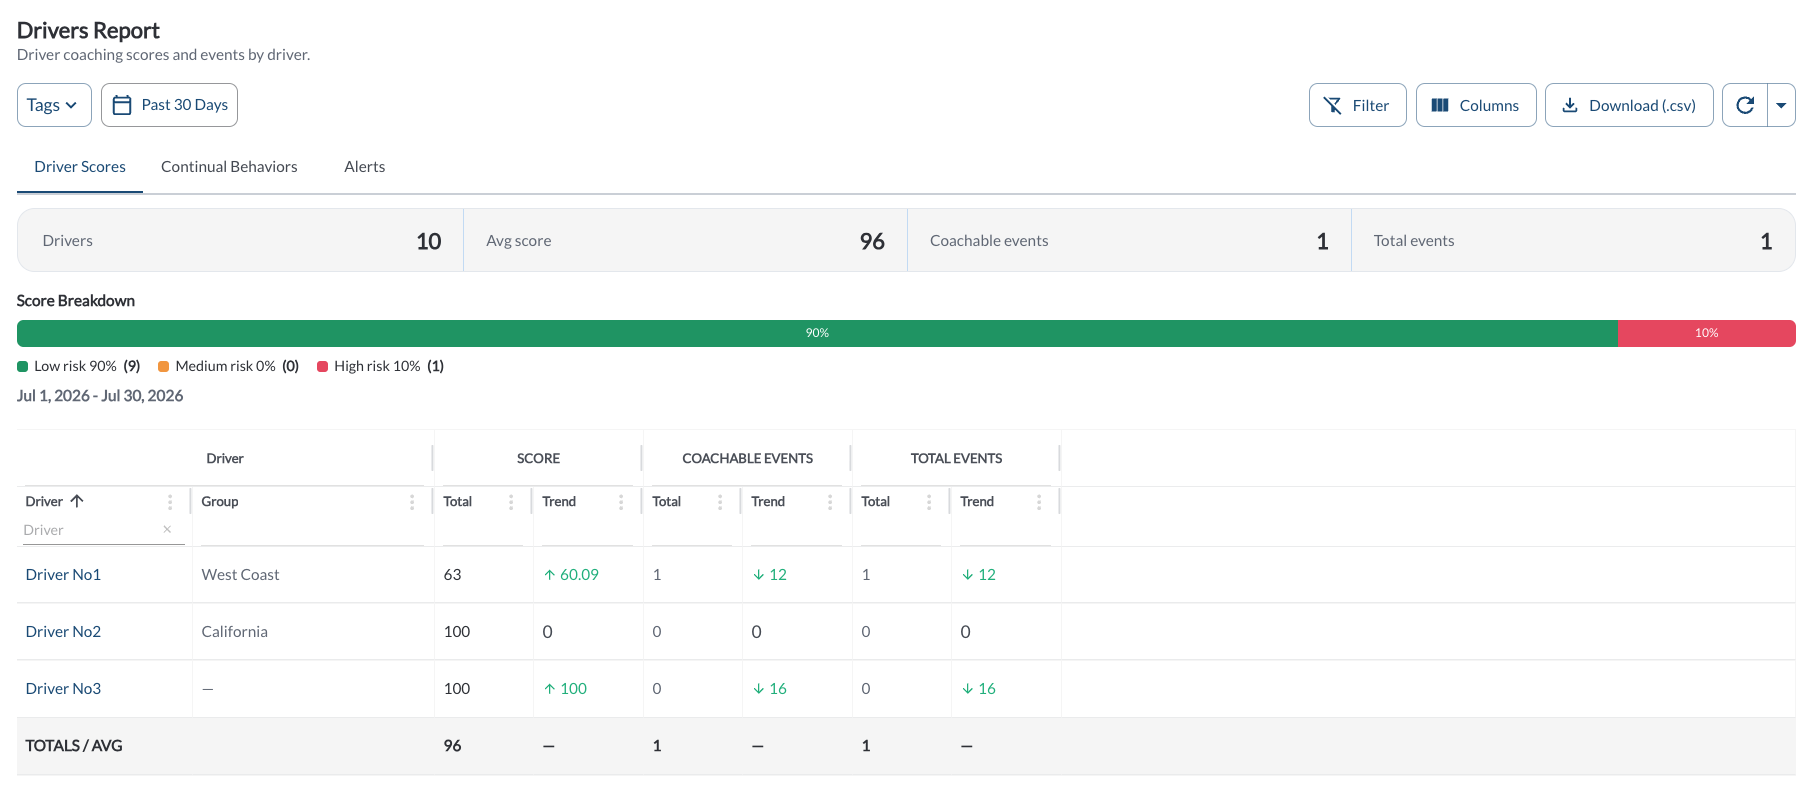
Summary Bar
A card across the top of the tab summarizes the whole driver population for the selected period.
| Drivers |
How many drivers are included. |
| Avg score |
The average Safety Score across those drivers. |
| Coachable events |
Events with a coachable Coaching Status. Excludes dismissed events and recognitions. |
| Total events |
All safety events in the period, including dismissed events and recognitions. |
Note
Drivers who did not drive in the period still count towards Drivers and contribute
a score of 100 to Avg score. On a fleet with many inactive drivers the average
reads higher than the active population alone. Read the article
Understanding the Driver Safety Score.
Score Breakdown
Below the summary bar, a stacked bar shows how the drivers divide across risk bands. A legend under the bar names each band with its percentage and its driver count:
| Low risk |
Green |
| Medium risk |
Amber |
| High risk |
Red |
A band with no drivers shows 0% and a count of zero in the legend, and contributes no visible segment to the bar. The date range the figures cover is printed beneath the legend.
This is the quickest way to see whether a low average score is the whole fleet drifting or a small number of drivers pulling it down. A single driver in High risk is a coaching conversation; a third of the fleet in High risk is a program question.
Columns
| Driver |
The driver's name. Click it to open the driver profile. Sorted A–Z by default. |
| Tags |
The groups the driver belongs to. |
| Score: Total |
The Safety Score for the period, from 0 to 100, shown to two decimal places. |
| Score: Trend |
The change against the previous period of equal length. A downward arrow is shown in red, because a falling score is a decline. |
| Coachable Deductions: Total |
The raw sum of behavior points before distance is applied. Can be negative when recognition credits outweigh deductions. |
| Coachable Events: Total / Trend |
Events with a coachable Coaching Status. Excludes dismissed events and recognitions. |
| Total Events: Total / Trend |
All safety events for the driver in the period, including dismissed events and recognitions. |
| Distance |
Distance travelled in the period. The unit follows your fleet's unit system setting. Read the article Fleet Settings. |
Note
A driver with a score of 100 and zero distance did not drive in the period.
Read Score alongside Distance before drawing conclusions. For the full calculation,
read the article
Understanding the Driver Safety Score.
Continual Behaviors Tab
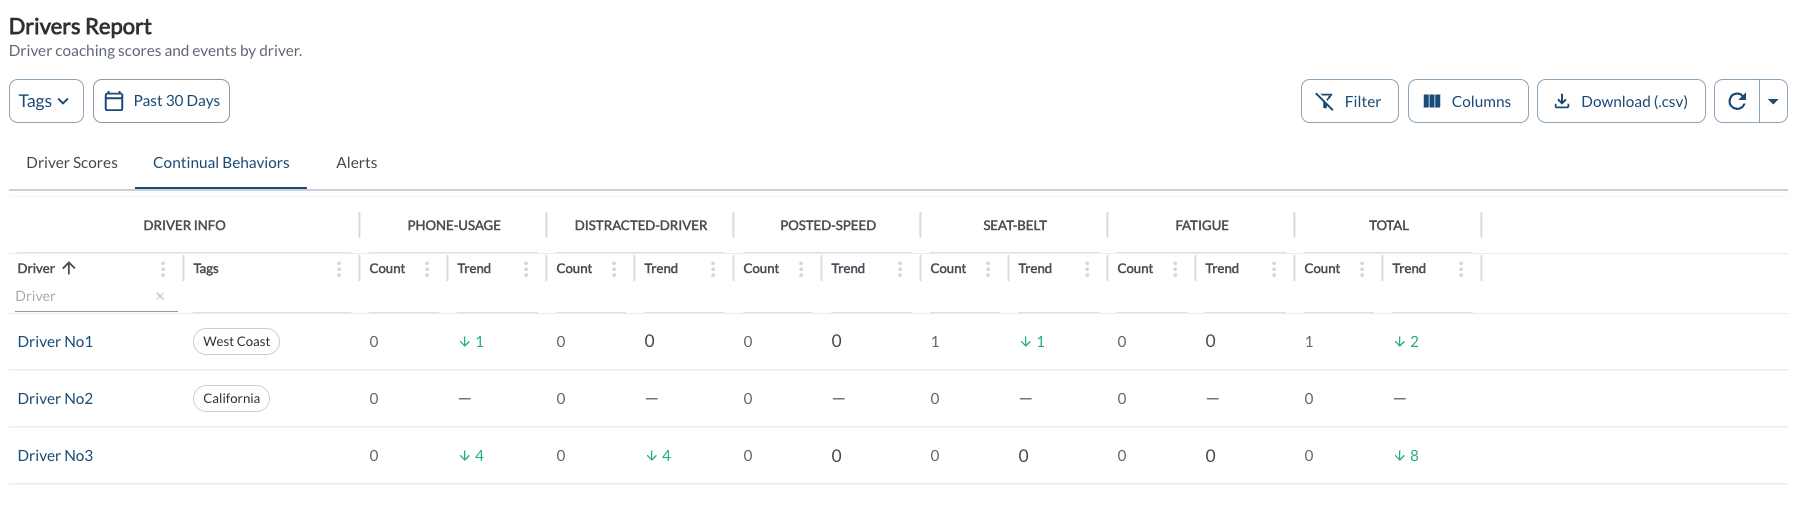
Frequency and trend for the behaviors that tend to continue over a stretch of driving:
| Driver |
The driver's name. Click it to open the driver profile. |
| Tags |
The groups the driver belongs to. |
| One pair of columns per behavior: Count / Trend |
How many times that behavior occurred in the period, and the change against the previous period of equal length. |
| Total: Count / Trend |
The sum across the five behaviors above. |
Alerts Tab
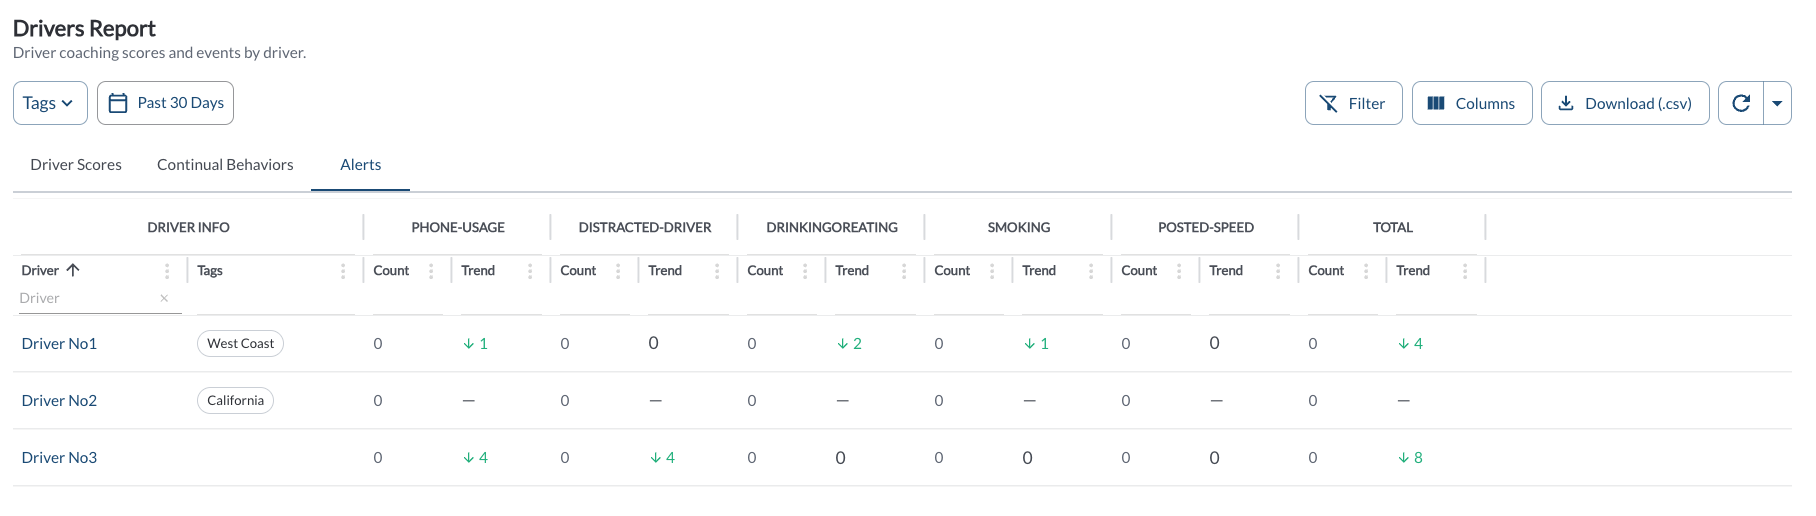
Frequency and trend for the five in-cab behaviors most often used for alerting:
| Driver |
The driver's name. Click it to open the driver profile. |
| Tags |
The groups the driver belongs to. |
| One pair of columns per behavior: Count / Trend |
How many times that behavior occurred in the period, and the change against the previous period of equal length. |
| Total: Count / Trend |
The sum across the five behaviors above. |
Filtering
-
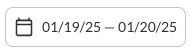
Use the Date Picker to select a different date range. The default date range is Today. For more details on using the Date Picker, read the article How to Use the Date Picker.
-
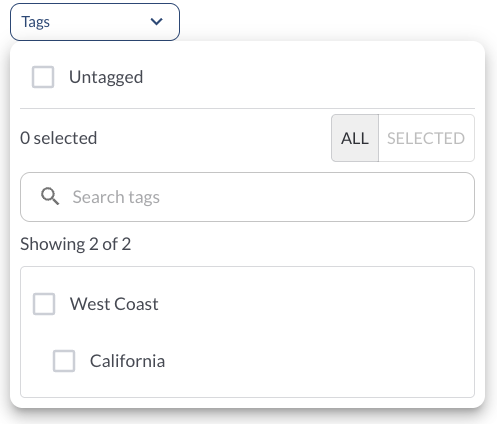
Use the Tag Filter to narrow down the table to display only trips associated with specific tags.
Refresher Widget
Keep your data up to date by using the Refresher Widget. This allows you to reload the table data so you're always viewing the latest information. To learn more, read the article How to Set the Refresher Widget.
Custom Report Widget
Save time by using the Custom Report Widget to store report configurations with your selected filters, columns, sorting, and grouping. This allows you to quickly return to commonly used report setups and set a default configuration for easy access. For more information, read the article How to Use the Custom Report Widget.