
The Coaches Report summarizes coaching activity and outcomes for every user who completed at least one coaching session in the selected period. It helps managers see how quickly coaching is happening and how well it is landing.
Coaches Report Details
The table supports downloading, sorting, filtering, resizing columns, and other customization options. For a complete guide, read the article How to Use Tables in the App.
| Coach |
The coach's name. Click it to open the coach profile. Sorted A–Z by default. |
| Tags |
The coach's own access tags, which determine the drivers and assets they can see. These are not the tags of the drivers they coach. |
| Coaching Effectiveness |
The percentage of coached behaviors that did not recur within 30 days. Hover over the column header for the definition. |
| Avg Days to Coach |
Average days between the earliest event on a task and the completion of the session. |
| Coached Events |
Distinct events covered by this coach's sessions in the period. |
| With Notes |
Percentage of sessions in which the coach recorded session notes or per-event notes. |
| Last Login |
When the coach last signed in. |
Note
Sessions completed in the last 30 days of the selected period are not counted
towards
Coaching Effectiveness, because a behavior needs a full 30 days of
observation. For the full explanation, read the article
Understanding Coaching
Effectiveness.
Filtering
-
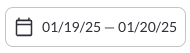
Use the Date Picker to select a different date range. The default date range is Today. For more details on using the Date Picker, read the article How to Use the Date Picker.
-
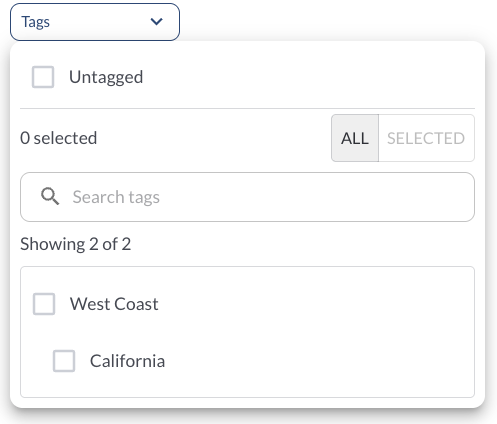
Use the Tag Filter to narrow down the table to display only trips associated with specific tags.
Refresher Widget
Keep your data up to date by using the Refresher Widget. This allows you to reload the table data so you're always viewing the latest information. To learn more, read the article How to Set the Refresher Widget.