The Coach Profile expands one row of the Coaches Report into a full page: the coach's headline metrics, how their effectiveness has moved over time, the drivers they coached, and how they performed per behavior category.
Open it by clicking a coach's name on the Coaches Report. There is no menu entry.
Page Header

The header shows the coach's name, email, last login, and their access-tag chips. A Date Range picker in the header sets the period for the whole page – metrics, chart, and both tabs. The default is the last 30 days.
Metrics

| Coaching Effectiveness |
The percentage of coached behaviors that did not recur within 30 days. The caption shows how many behaviors were coached and how many recurred. |
| Sessions |
Coaching sessions completed in the period. |
| Coached Events |
Distinct events covered by those sessions. |
| Avg Days to Coach |
Average days between the earliest event on a task and the completion of the session. |
| With Notes |
Percentage of sessions that included session notes or per-event notes. |
Coaching Effectiveness Trend
A line chart of Coaching Effectiveness over the period, with one point per day and a fixed axis from 0% to 100%. Hover over a point to see the number of sessions, the behaviors coached, and the split between effective and repeated behaviors.
Note
Days with no sessions, and days where the behaviors coached have not yet had a full 30 days of observation, appear as gaps rather than being connected. On fleets that coach infrequently the line can look sparse; this is expected.
Drivers Tab
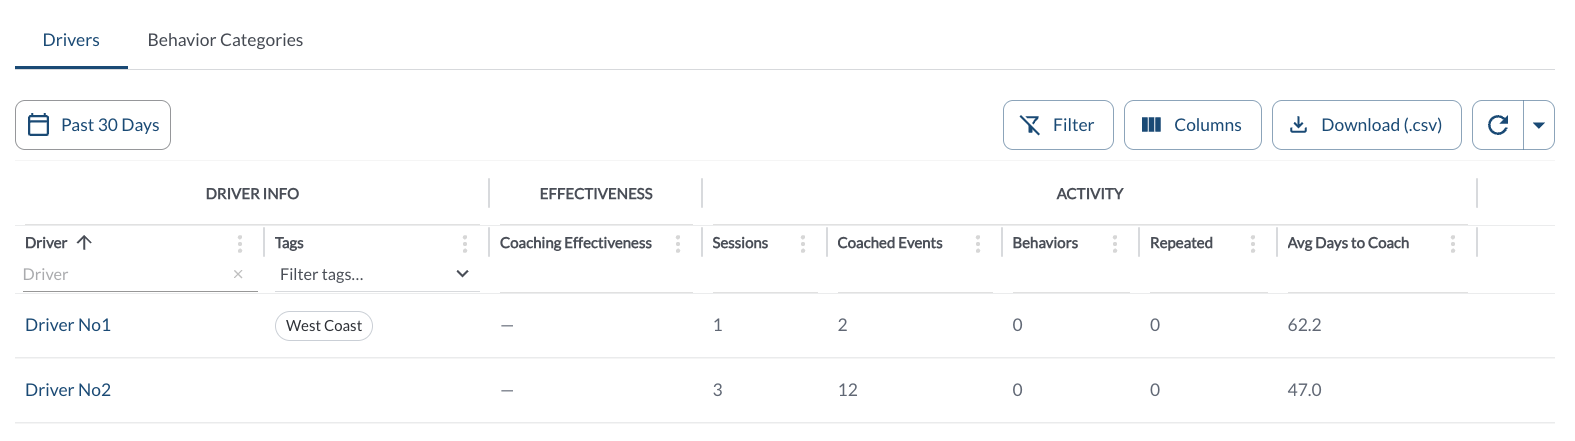
One row per driver this coach coached in the period. The table supports downloading, sorting, filtering, resizing columns, and other customization options. For a complete guide, read the article How to Use Tables in the App.
| Driver |
The driver's name. Click it to open the driver profile. Sorted A–Z by default. |
| Tags |
The groups the driver belongs to. |
| Coaching Effectiveness |
Scoped to the sessions this coach ran for this driver. |
| Sessions |
Sessions this coach ran for this driver in the period. |
| Coached Events |
Distinct events covered by those sessions. |
| Behaviors |
Total behaviors coached across those sessions. |
| Repeated |
How many of those behaviors recurred within 30 days. Lower is better. |
| Avg Days to Coach |
Average days between the earliest event on a task and the completion of the session. |
Note
A driver coached by more than one coach shows a different Coaching Effectiveness on each coach's profile, because the metric only counts the sessions run by that coach.
Behavior Categories Tab

| Category |
The behavior category. Behaviors that are no longer in the supported catalog appear as Uncategorized. |
| Behaviors Coached |
How many behaviors in this category were coached. |
| Repeated |
How many recurred within 30 days. |
| Distinct Drivers |
How many drivers contributed to this category. |
| Effectiveness |
Effectiveness for this category, to one decimal place. |
Filtering
-
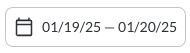
Use the Date Picker to select a different date range. The default date range is Today. For more details on using the Date Picker, read the article How to Use the Date Picker.
Refresher Widget
Keep your data up to date by using the Refresher Widget. This allows you to reload the table data so you're always viewing the latest information. To learn more, read the article How to Set the Refresher Widget.